Big-Data-Title3
Big-Data-Title3Mobile

With the rapid development of processing power over the last decade, there may be a new way to improve health care. Powerful computers can analyze immense data sets and determine which interventions will produce the biggest net benefit.


The idea has been likened to ‘Moneyball’, the 2011 movie that tells the story of legendary baseball manager Billy Beane, who shakes up the major leagues by turning to Big Data. Ignoring the advice of his seasoned scouts, he decides his starting lineup solely by the stats.

Dr. Chris Murray is the global health equivalent of Billy Beane. Murray is the director of the Institute for Health Metrics and Evaluation (IHME) and he’s into Big Data in a big way. If you’ve heard the statistic that the US ranked 37th in the world for health care, you’re familiar with the work of Dr. Chris Murray.

That work started very young.

Close the dialog

The World Health Report 2000 — Health systems: Improving performance.
Geneva: World Health Organization, 2000.

1 France
2 Italy
3 San Marino
4 Andorra
5 Malta
6 Singapore
7 Spain
8 Oman
9 Austria
10 Japan
11 Norway
12 Portugal
13 Monaco
14 Greece
15 Iceland
16 Luxembourg
17 Netherlands
18 United Kingdom
19 Ireland
20 Switzerland
21 Belgium
22 Colombia
23 Sweden
24 Cyprus
25 Germany
26 Saudi Arabia
27 United Arab Emirates
28 Israel
29 Morocco
30 Canada
31 Finland
32 Australia
33 Chile
34 Denmark
35 Dominica
36 Costa Rica
37 USA
38 Slovenia
39 Cuba
40 Brunei
...
180 Ethiopia
181 Angola
182 Zambia
183 Lesotho
184 Mozambique
185 Malawi
186 Liberia
187 Nigeria
188 Democratic Republic of the Congo
189 Central African Republic
190 Myanmar

Swipe to navigate slideshows

Murray wanted an answer to a simple question: what makes people sick?


He wasn’t alone. Bill Gates was looking for a way to get the best return on his philanthropic investments. In 2007, Gates awarded a $105 million grant to IHME.

“We can’t cure what we don’t understand. If we know what the biggest killers are, we can make sure our efforts to save lives are aimed at the right things.”

BILL GATES

“We can’t cure what we don’t understand. If we know what the biggest killers are, we can make sure our efforts to save lives are aimed at the right things.”

BILL GATES

HOW DO YOU MEASURE HEALTH?

It’s a simple idea: find the biggest killers, and focus on fighting them.


That’s not as easy as it sounds. In 2013, three million people died from ischemic stroke. That’s over three times the deaths from malaria. But death toll does not tell the whole story.

Shuffle the stats with the buttons.

The data show deaths from stroke are concentrated in those over 70, whereas malaria is primarily a killer of kids. The numbers are staggering. Over half a million under the age of five died of malaria. Each child lost a lifetime.


The unfortunate fact is we all die eventually of something; simply counting deaths isn’t a good way of measuring health. So Chris Murray created a new metric, the Disability Adjusted Life Year, or DALY.

HOW DALYS ARE CALCULATED

DEEP DIVE: PROCESS

The equation for the Disability Adjusted Life Year is simple:


DALY = Years Lived with Disability (YLD) + Years of Life Lost (YLL)


For YLL, a standardized table assigns years of life lost to an early death. So for example if a newborn dies, they have lost 86 years of life (based on the highest life expectancy, found in Japan).


YLD is calculated by adding a disability weight adjustment to any years lived with a disease or injury. So a year of full health adds no DALYs, a year of death adds 1 DALY, and a year lived with say, metastatic cancer adds 0.45 DALYs.


In other words, a year lived with cancer is counted as half as healthy as a year of full health.


Where does that figure come from? You, or someone like you.


IHME have surveyed 60,890 people in nine countries with questions similar to a game you may have played as a kid: would you rather be deaf or blind? But in their version of the game, there’s no mention of the condition. The survey questions describe the symptoms of a particular condition in lay terms, so that the stigma associated with that condition doesn’t affect the outcome.


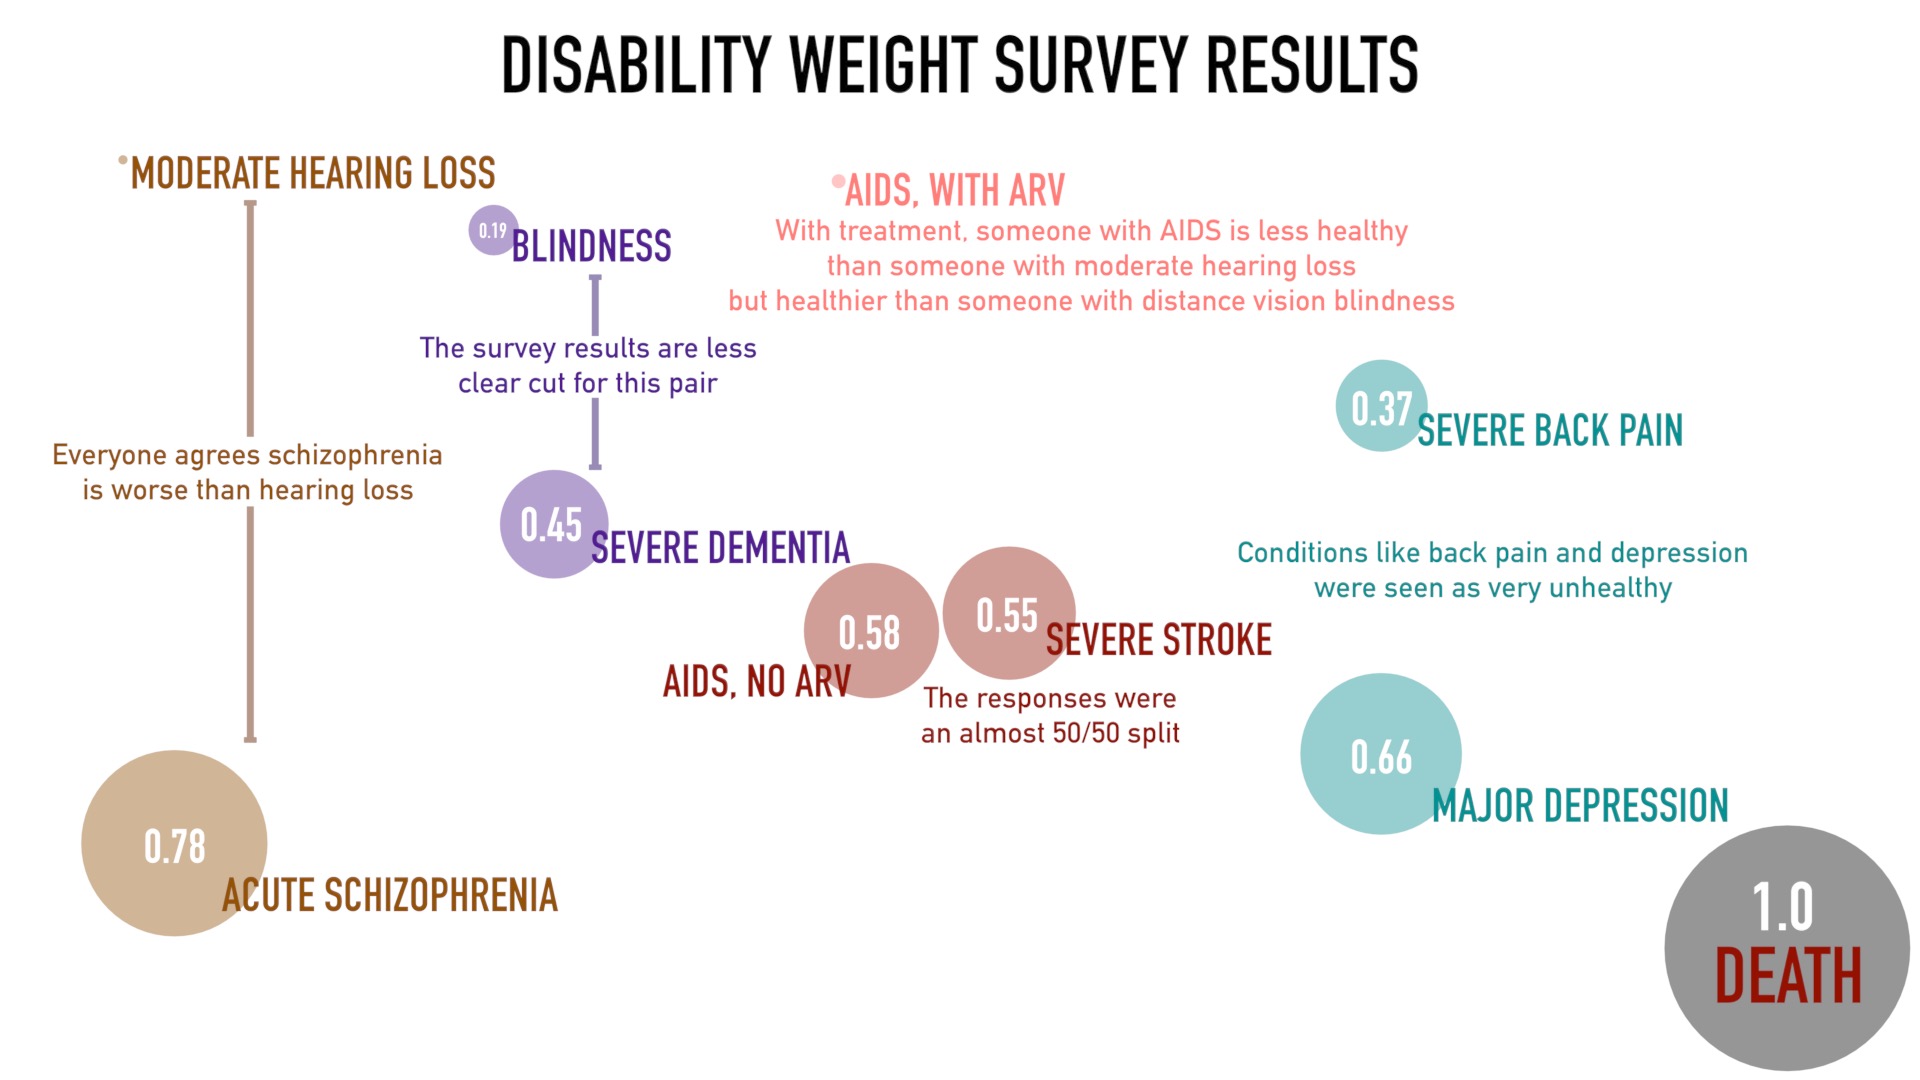
Try out part of the survey. Click on ‘Reveal Conditions’ to see what the results tell us.

2pixseperator

Who do you think is healthier overall?

2pixseperator

Who do you think is healthier overall?

2pixseperator

Who do you think is healthier overall?

2pixseperator

Using the data generated from the survey, IHME calculated a disability weight adjustment for over two hundred health states.

DEEP DIVE: RESULTS

weights Still5

Disability weight adjustments are a number between 0 (perfect health) and 1 (death). They are the first step towards calculating the Global Burden of Disease (GBD), a population-level snapshot of the world’s health.


But can a survey really capture all the nuances of health? In particular it seems challenging to condense the experience of a disease into a description the length of a tweet, and the wording is clearly going to impact the weight adjustments.


IHME go to great lengths to highlight uncertainty in the disability weights study. For example, they were surprised how highly illicit drug use disorders ranked, and suggest that perhaps they didn’t get the wording of the symptoms quite right.


But there is a danger these details are lost in further studies. It seems unlikely that a policy paper based on a cost-effective study based on the global burden of disease study based on the disability weights study will discuss concerns over the wording of the largely unknown survey that underpins it all.


Nonetheless, in some cases results are so emphatic the uncertainty intervals become insignificant.

THE BIG PICTURE

Now, with a way to measure not only death, but also ill health, Murray can build the big picture. IHME collated over a billion metrics into an overview of the world’s health. Then they posted it online. For free.

GBD Compare is a square pie chart – the bigger the square, the bigger the health lost to a disease or injury. Red is infectious disease (like HIV or malaria), blue is non-communicable disease (like diabetes or cancer) and green is injuries. The data can be arranged by country and by year.

Change the year from 2013 to 1990. Huge improvements have been made in fighting infectious disease… in some places. Change the location to Niger, and then to the United States.

You can explore the full interactive on IHME’s website.

The DALY offers a way to measure health. Bill Gates now has an evidence-based approach to direct his dollars, and data is beginning to shake up the way we all think about philanthropy…

Up next… Effective Altruism.